
The World Meteorological Organization (WMO) has once again published its annual State of the Climate report, painting a now-familiar picture: rising greenhouse gas concentrations, escalating global temperatures, retreating glaciers, and the persistent signs of a warming planet. Yet, behind the broader trends, 2023 and 2024 stood out—not for continuing the warming pattern, but for exceeding it in unexpected ways.
Climate scientists Gavin Schmidt and Zeke Hausfather contributed a detailed synthesis to the report, focusing not on long-term warming, but on the short-term spikes—those anomalies that made 2023 and 2024 feel hotter than even the underlying trend would suggest. This work represents the first quantitative breakdown of the contributing factors behind these deviations, providing a rare window into what drove these two years to such climatic extremes.
Beyond the Trendline: What Are We Explaining?
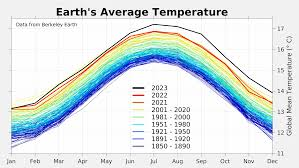
The science behind global warming is well established. Since the late 19th century, global temperatures have risen by roughly 1.5ºC, largely driven by human emissions of greenhouse gases. This steady trend has been slightly buffered or exaggerated at times by changes in air pollution, volcanic activity, and natural climate variability, but the direction is clear.
However, climate models are designed to project long-term trends, not necessarily to account for why one year is hotter than another. That’s where residuals—differences between the observed temperature and the expected trend—come into play. In 2023 and 2024, these residuals reached levels not seen in decades, with 2023 particularly perplexing because its anomaly was not predicted ahead of time.
Using a 20-year LOESS smooth (a type of flexible statistical curve) to define the expected global temperature trend up to 2022 and projected through 2024, Schmidt and Hausfather isolated these residuals and set out to explain what made those two years stand out.
Comparing Past and Present Anomalies
By historical standards, the residual anomaly in 2023 rivaled that of 2016 and 1998—two years heavily influenced by strong El Niño events. Yet in 2023, the El Niño was still developing and relatively weak. In contrast, 2024’s anomaly coincided with a moderate El Niño, suggesting some connection. To tease out this influence, the authors employed statistical regression, comparing yearly residuals to the February/March Niño 3.4 index—a common indicator of El Niño strength.
Breaking Down the Influences
To better understand what drove the spikes, the researchers looked at a range of contributors:
- El Niño–Southern Oscillation (ENSO): While ENSO had little impact in 2023, it played a significant role in 2024. The difference helps explain why 2023 remains more mysterious.
- Solar Cycle: Surprisingly, the solar cycle’s contribution was comparable to that of the changes in marine shipping emissions. As the sun nears a peak in activity, even small increases in solar radiation can add up.
- Shipping Emissions (IMO Regulations): New regulations aimed at reducing sulfur emissions from ships have resulted in clearer skies over the oceans. While better for air quality and health, this also means less sunlight is reflected back into space—leading to a warming effect. Still, the data suggest this warming was only a portion of what was observed.
- Hunga Tonga Volcano: The massive eruption in 2022 injected large amounts of material into the atmosphere. While it added water vapor (a greenhouse gas) to the stratosphere, it also released sulfur dioxide (SO₂), which has a cooling effect. Net result? A small cooling, contrary to some earlier assumptions.
- East Asian Aerosols: A dramatic decline in sulfur dioxide emissions from East Asia since the mid-2000s has been gradually contributing to global warming. But because the change has been slow and steady, it had minimal impact on the 2023–2024 anomalies.
These individual contributions were then summed—assuming independence among them—and compared to the actual observed residuals. The result? The combined model matched 2024 quite closely. But for 2023, there remained a gap between expected and observed temperatures, even within statistical uncertainty ranges.
Why 2023 Remains a Puzzle
The core takeaway is that 2023 is harder to explain than 2024. Even with contributions from known sources—El Niño, solar variability, aerosols, and volcanic activity—the numbers don’t quite add up. That doesn’t mean science has hit a wall, but rather that more detailed modeling is needed.
Upcoming work with Earth System Models (ESMs) that include updated datasets on aerosols, solar activity, and ocean-atmosphere interactions may help fill the gaps. For example, regional changes in aerosols might have outsized impacts on global averages. The simple reliance on one ENSO index may miss more nuanced ocean dynamics. And volcanic or solar impacts might have cascading effects not yet fully captured by current simulations.
Looking Ahead
As we continue to confront an increasingly volatile climate system, the ability to attribute and explain anomalies is becoming more important. It helps us refine models, improve forecasts, and anticipate the real-world impacts of policy changes like emissions regulations.
The work by Schmidt and Hausfather represents a major step in that direction. Their synthesis not only provides a framework for future attributions but also underscores the complexity of the Earth’s climate. While we may not have all the answers yet—especially for the unusual heat of 2023—we’re narrowing the possibilities, and with each passing year, the picture becomes just a little clearer.
Would you like a visual breakdown of the individual contributors to the temperature anomalies?
